Introduction
In the field of ancient human population genetics, we often analyse ancient genomes with high proportions of missing data, namely in the recovered genotypes. This can stem from limitations of material preservation, and/or of available laboratory/sequencing technologies. Given that sampling remains for ancient DNA is a destructive process, we have an ethical responsibility to make the most of the data we are able to generate. At the same time, we need to know exactly the limitations of our data when inferring results, and present our findings fairly and compassionately. After all, the past gives rise to the present, and the interpretations we make of the past can have implications affecting living peoples and communities.
To that end, as archaeogeneticists we often use quality cutoff thresholds in our analyses, limiting the set of analysed individuals to ones with sufficient SNP coverage for population genetics analyses. These cutoffs are often expressed in terms of the “Number of covered SNPs”, i.e. the number of SNPs which do not have a missing genotype call for a given ancient individual. But what constitutes a sensible minimum cutoff?
Principal Component Analysis (PCA) is a very useful visualisation tool for human aDNA data, as well as the source of many-a popgen bingo. It is often the case that most (if not all) individuals in an ancient population genetics study will be featured in a PCA plot, and it is important to understand how missing data affects their position in order to avoid misinterpreting PCA results. So, I set out to find out:
How does missing data affect the projected position of individuals on a PCA plot? Can you trust the placement of that low coverage individual in the paper you’re reviewing, and if so to what degree?
Let’s find out!
Experimental setup
I started with a dataset of present day individuals genotyped on the Human Origins array (~600k SNPs) [1,2,3]. I picked a set of candidate present-day individuals (plus the ‘Loschbour’ hunter-gatherer) whose positions roughly spanned the area of each PCA plot. I then randomly replaced the existing genotypes with missing ones for each candidate individual at a given rate, creating 200 replicates per missingness rate, per individual.
I used smartpca [4] to run PCA and projected all replicates (lsqproject: YES, without any shrinkage correction) across all missingness rates for all candidate individuals.
The original candidate individuals were not projected, with the exception of ‘Loschbour’.
Compared to the other individuals, it is also the only individual with data to have been generated with ‘pseudohaploid’ genotypes in the experiment.
The ‘Loschbour’ hunter-gatherer can then act as a test case for true ancient data, where differences between the replicate spread of this individual to other candidate individuals could indicate that any or all of damage, genotyping procedure, and/or projecting individuals whose genetic variation is not directly included in the PC calculation can also affect the spread of data due to missingness.
I focused on four PCA setups that are somewhat prevalent in human aDNA literature:
-
Worldwide PCA
-
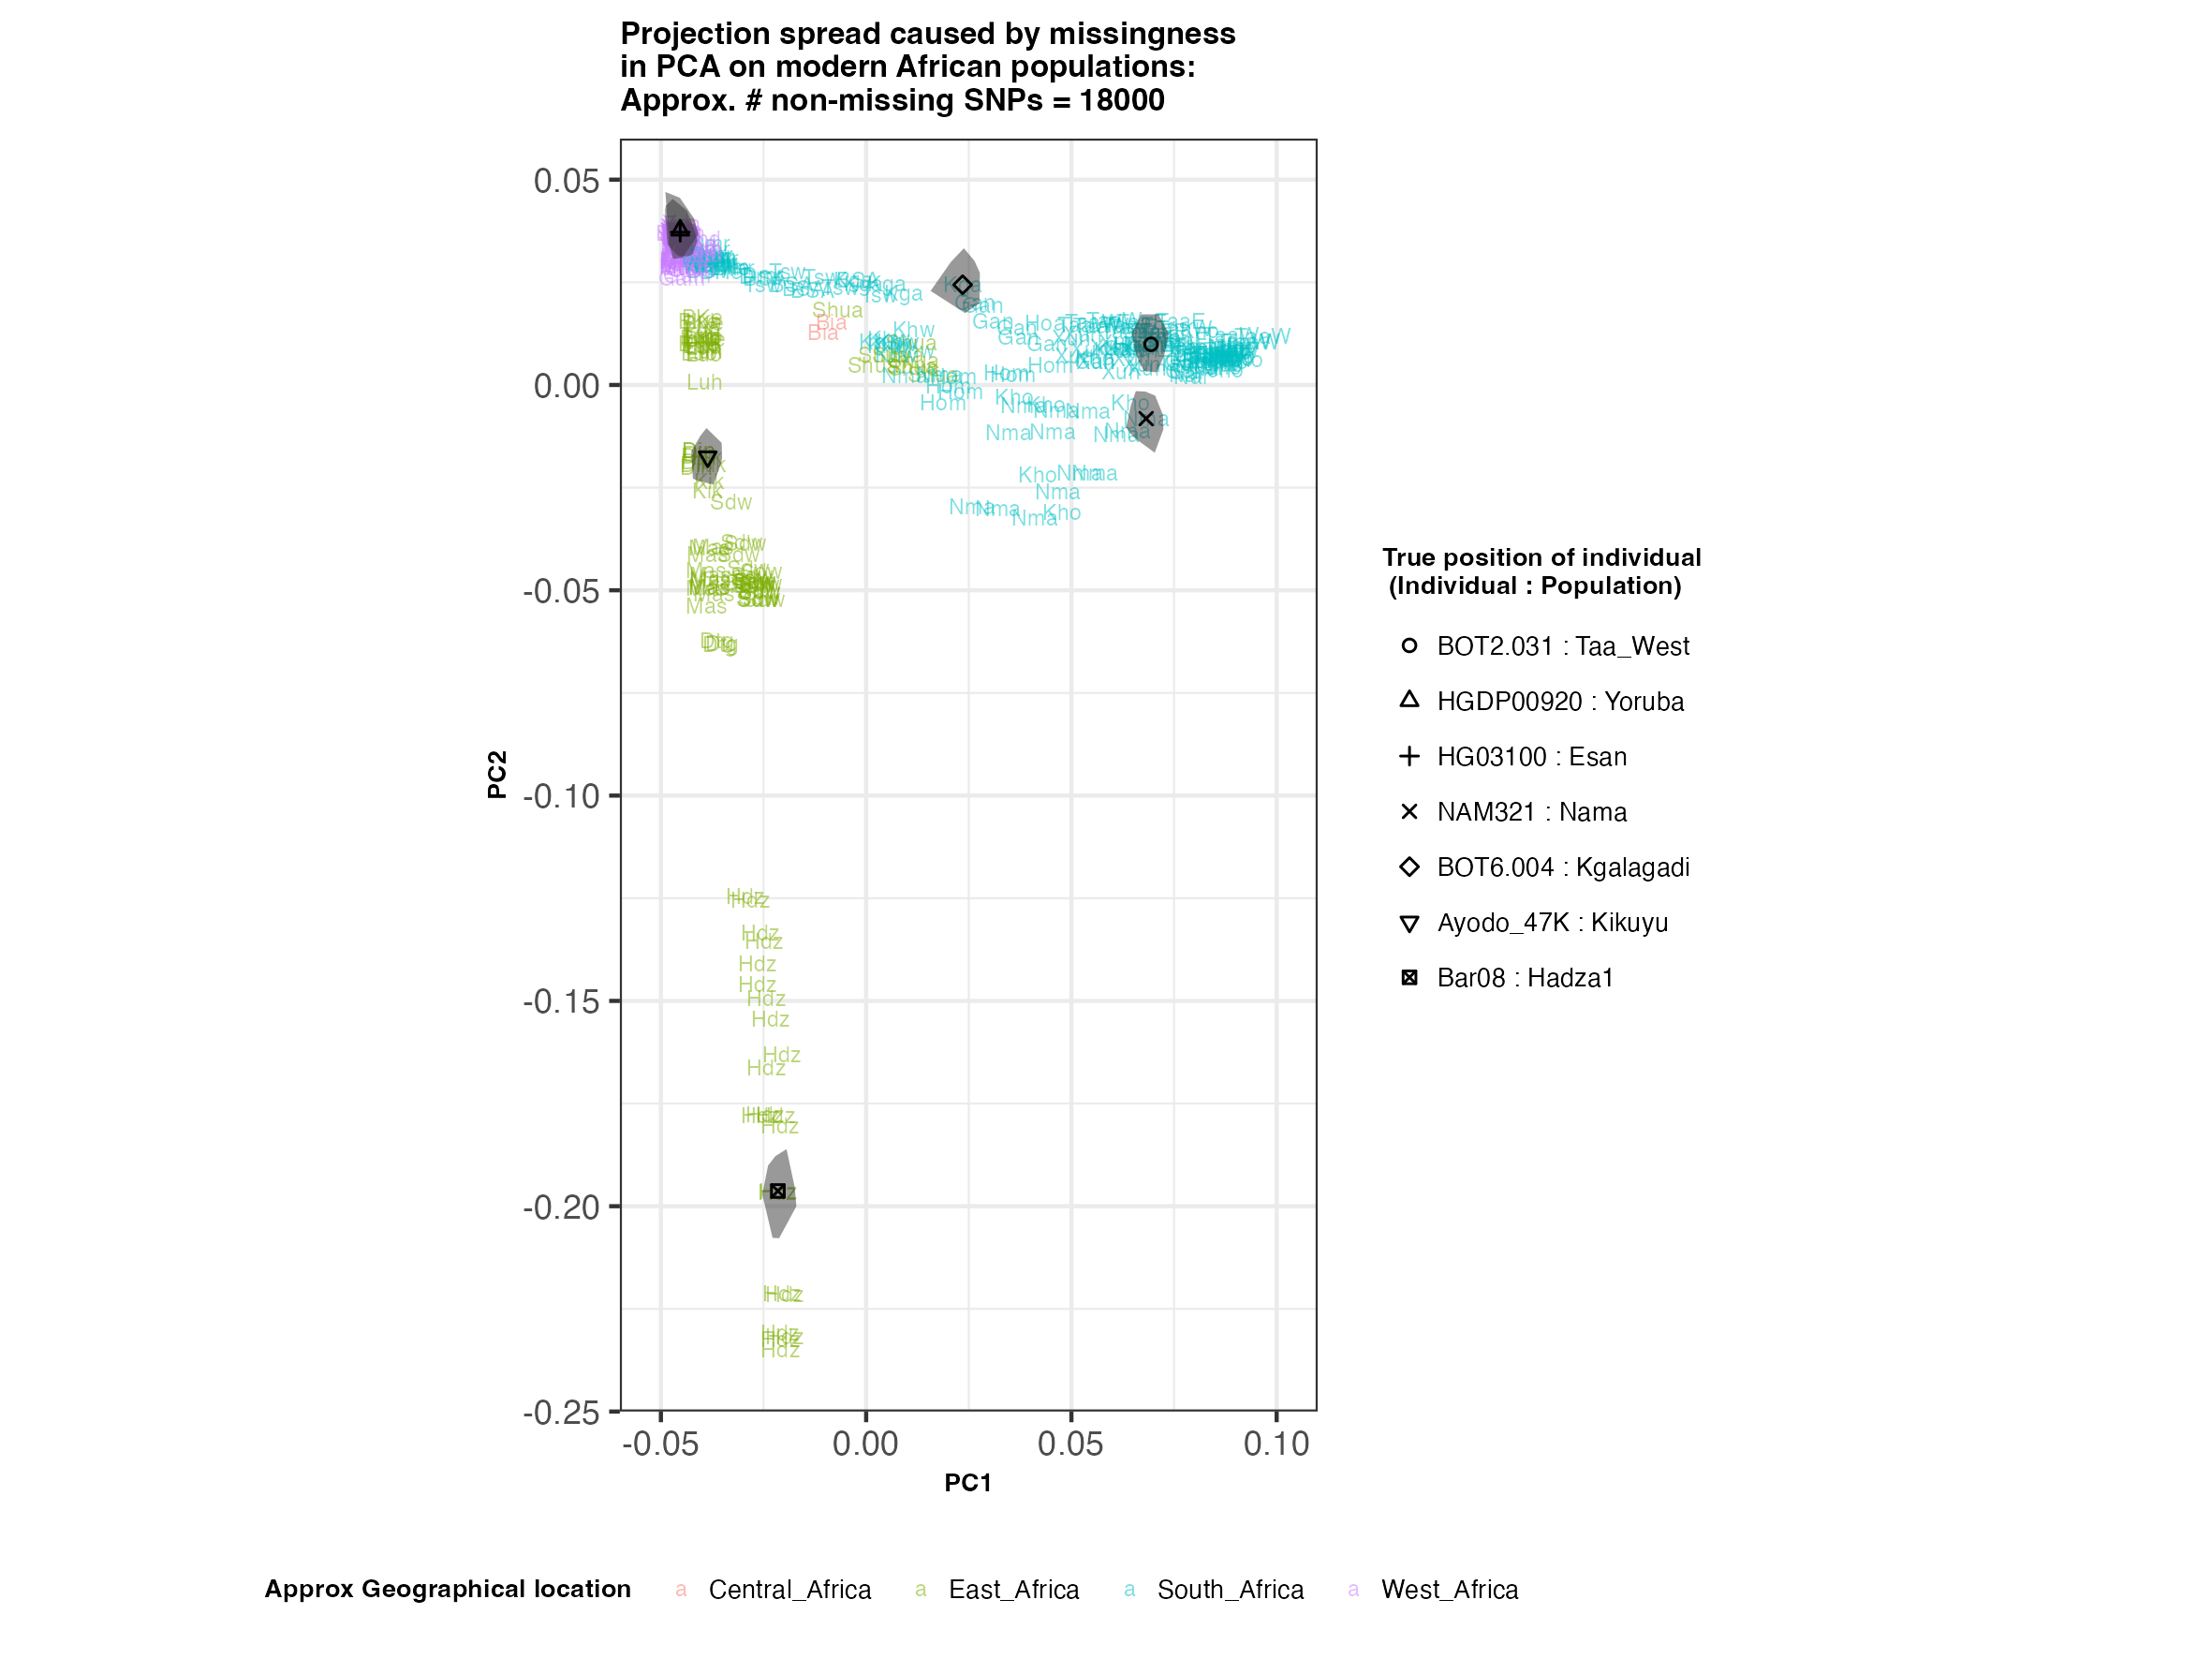
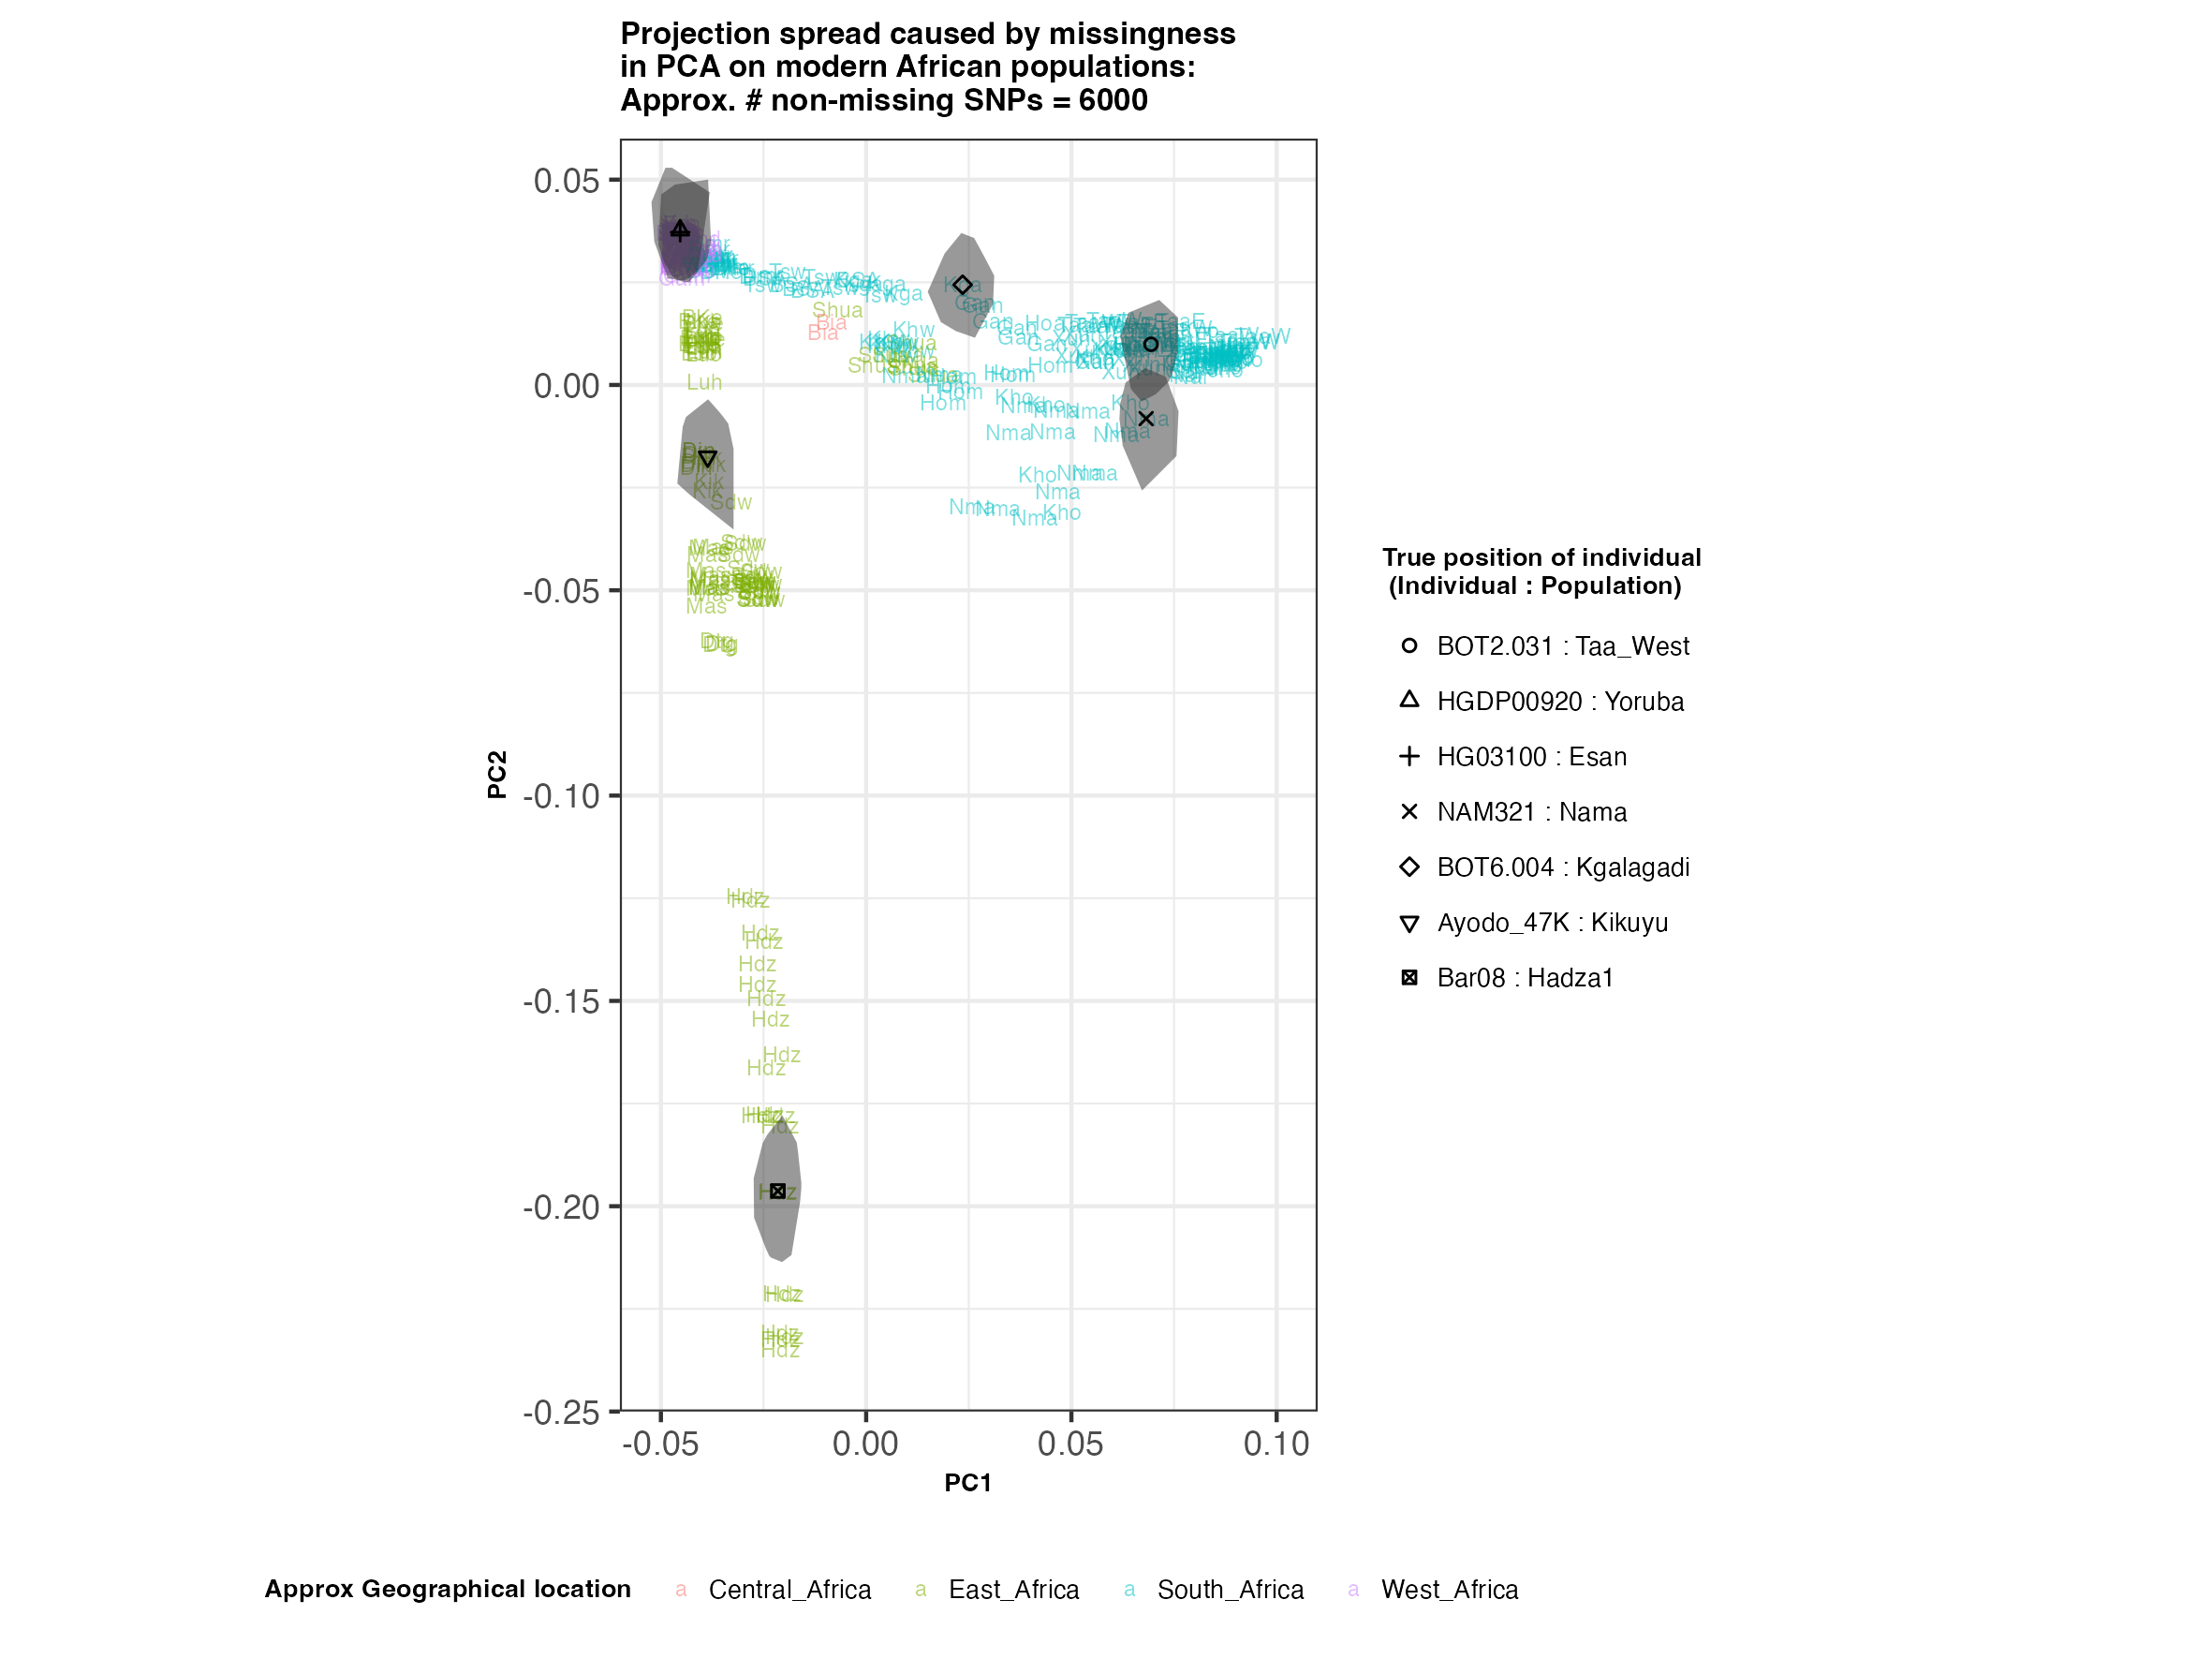
African PCA (à la Skoglund et. al 2017)
-
Eurasian PCA (à la Jeong2019)
-
West Eurasian PCA (à la Lazaridis et al. 2014)
Results
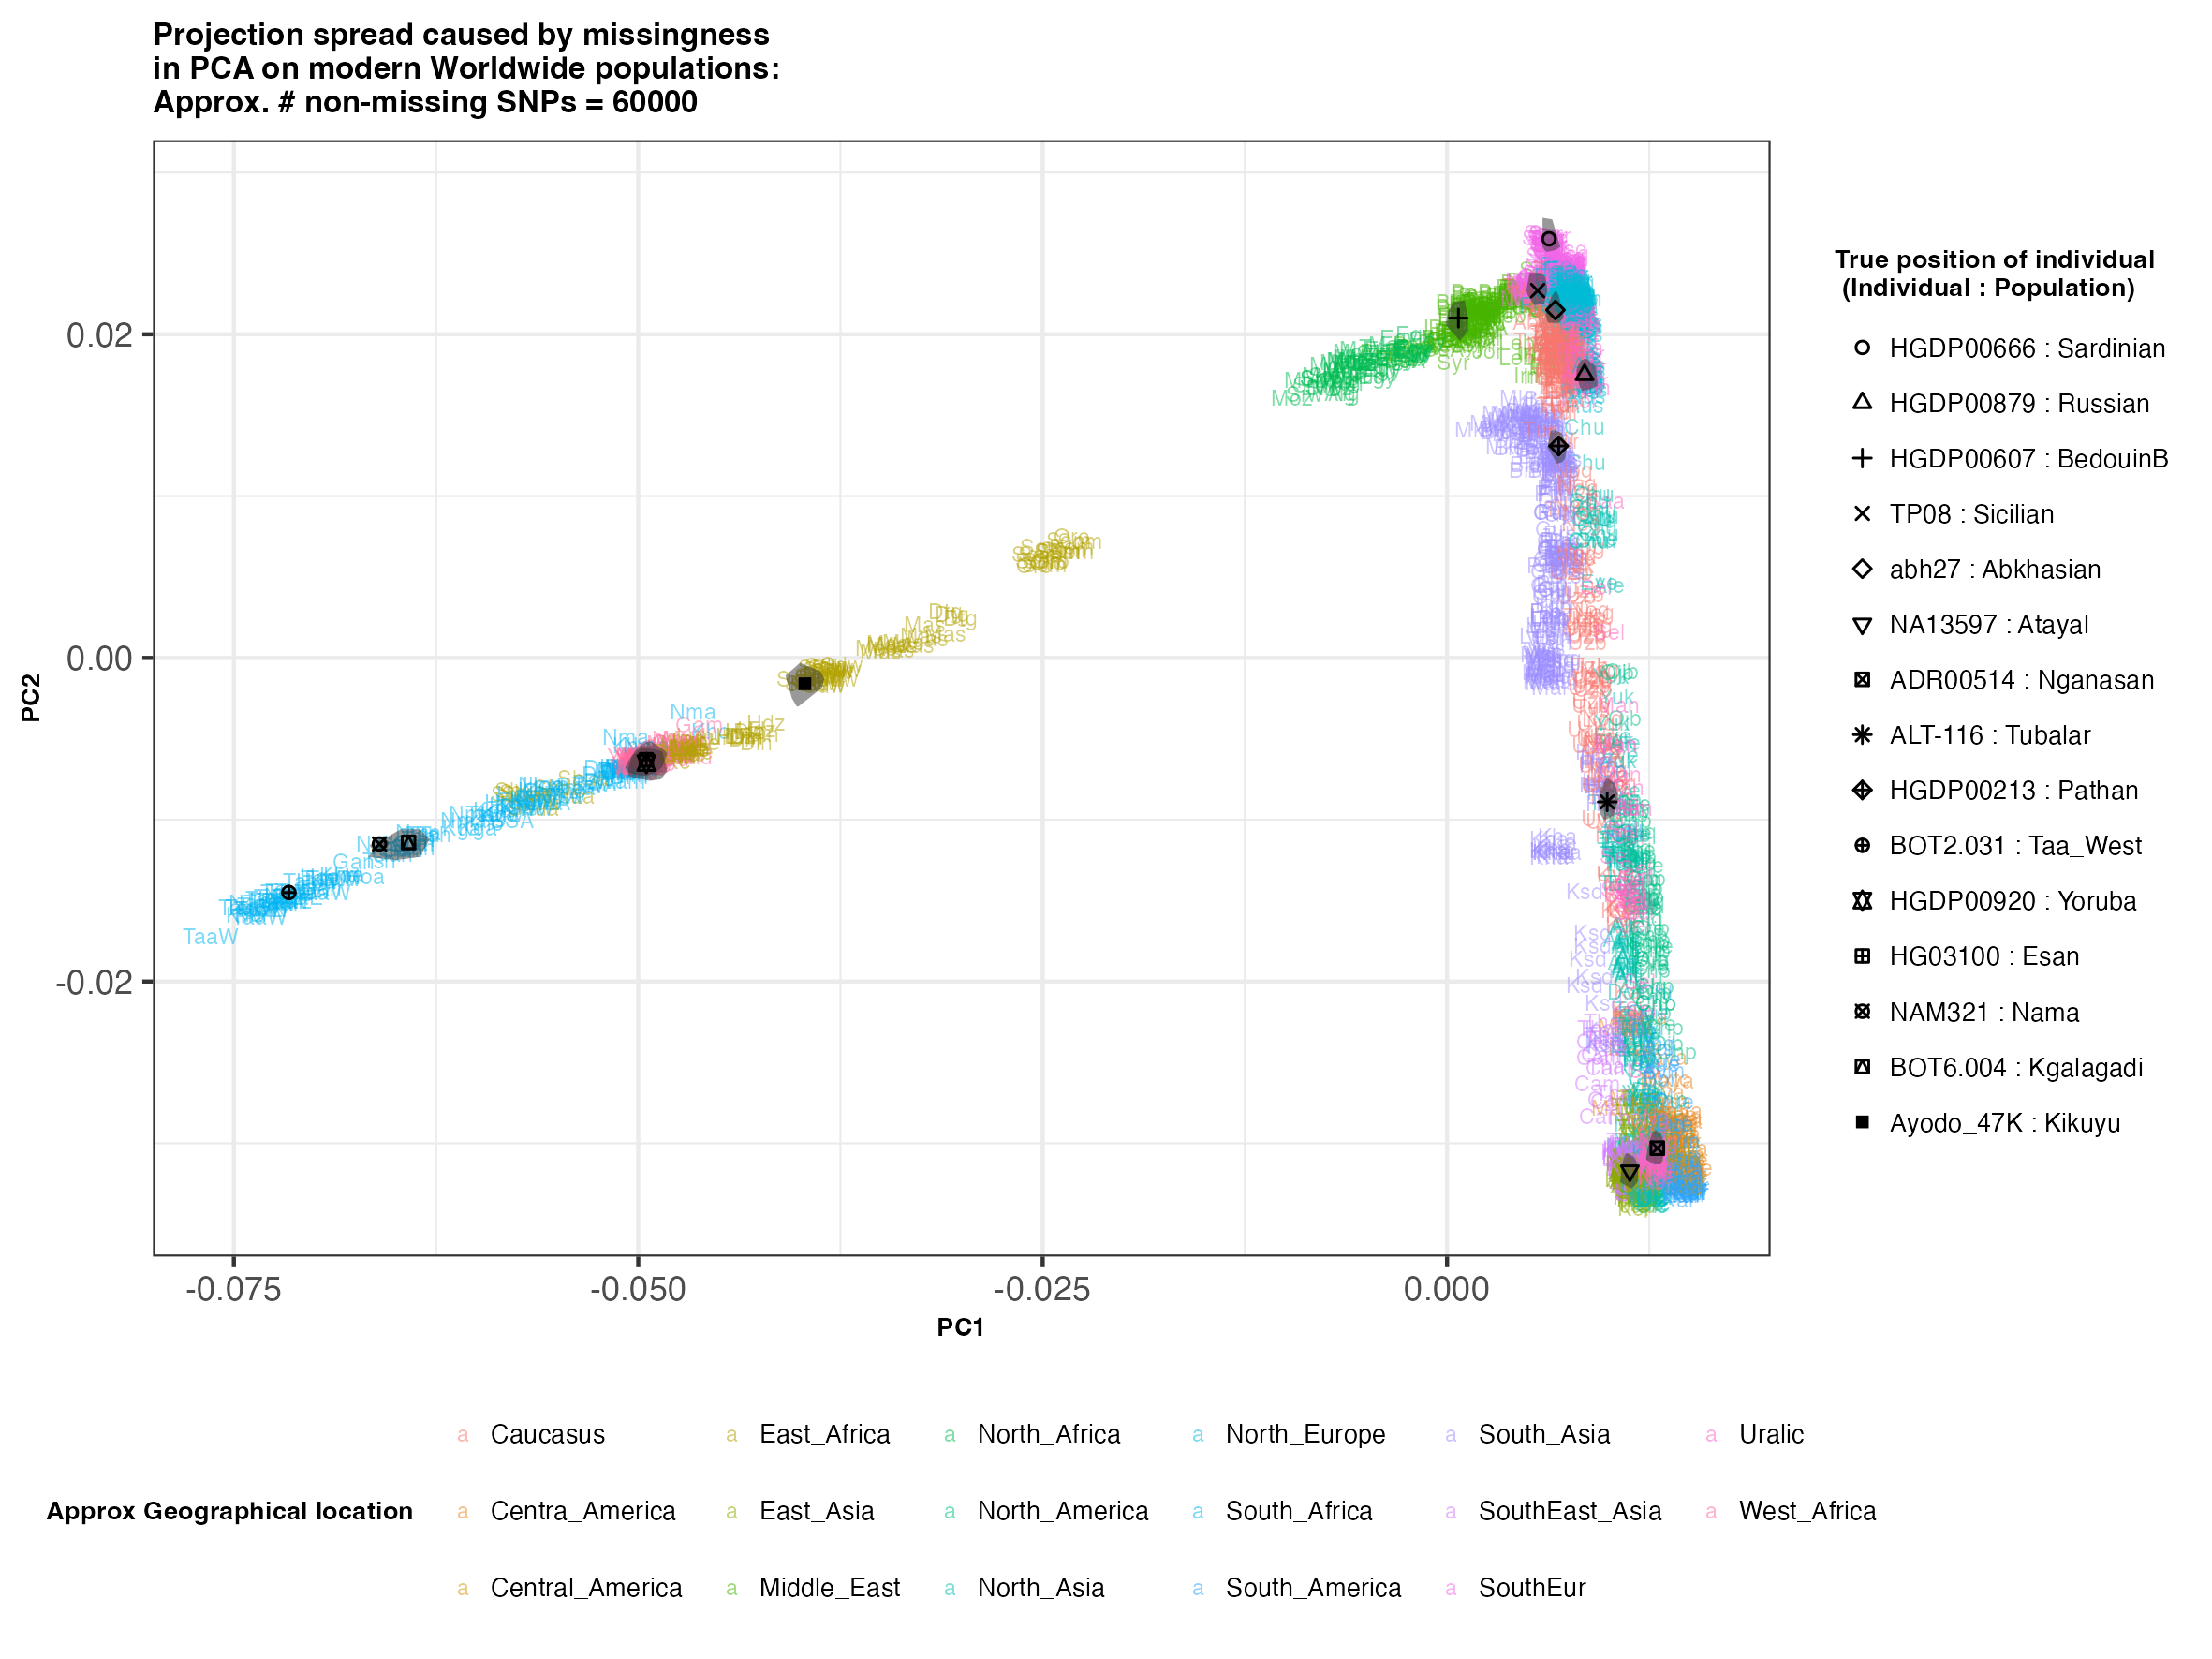
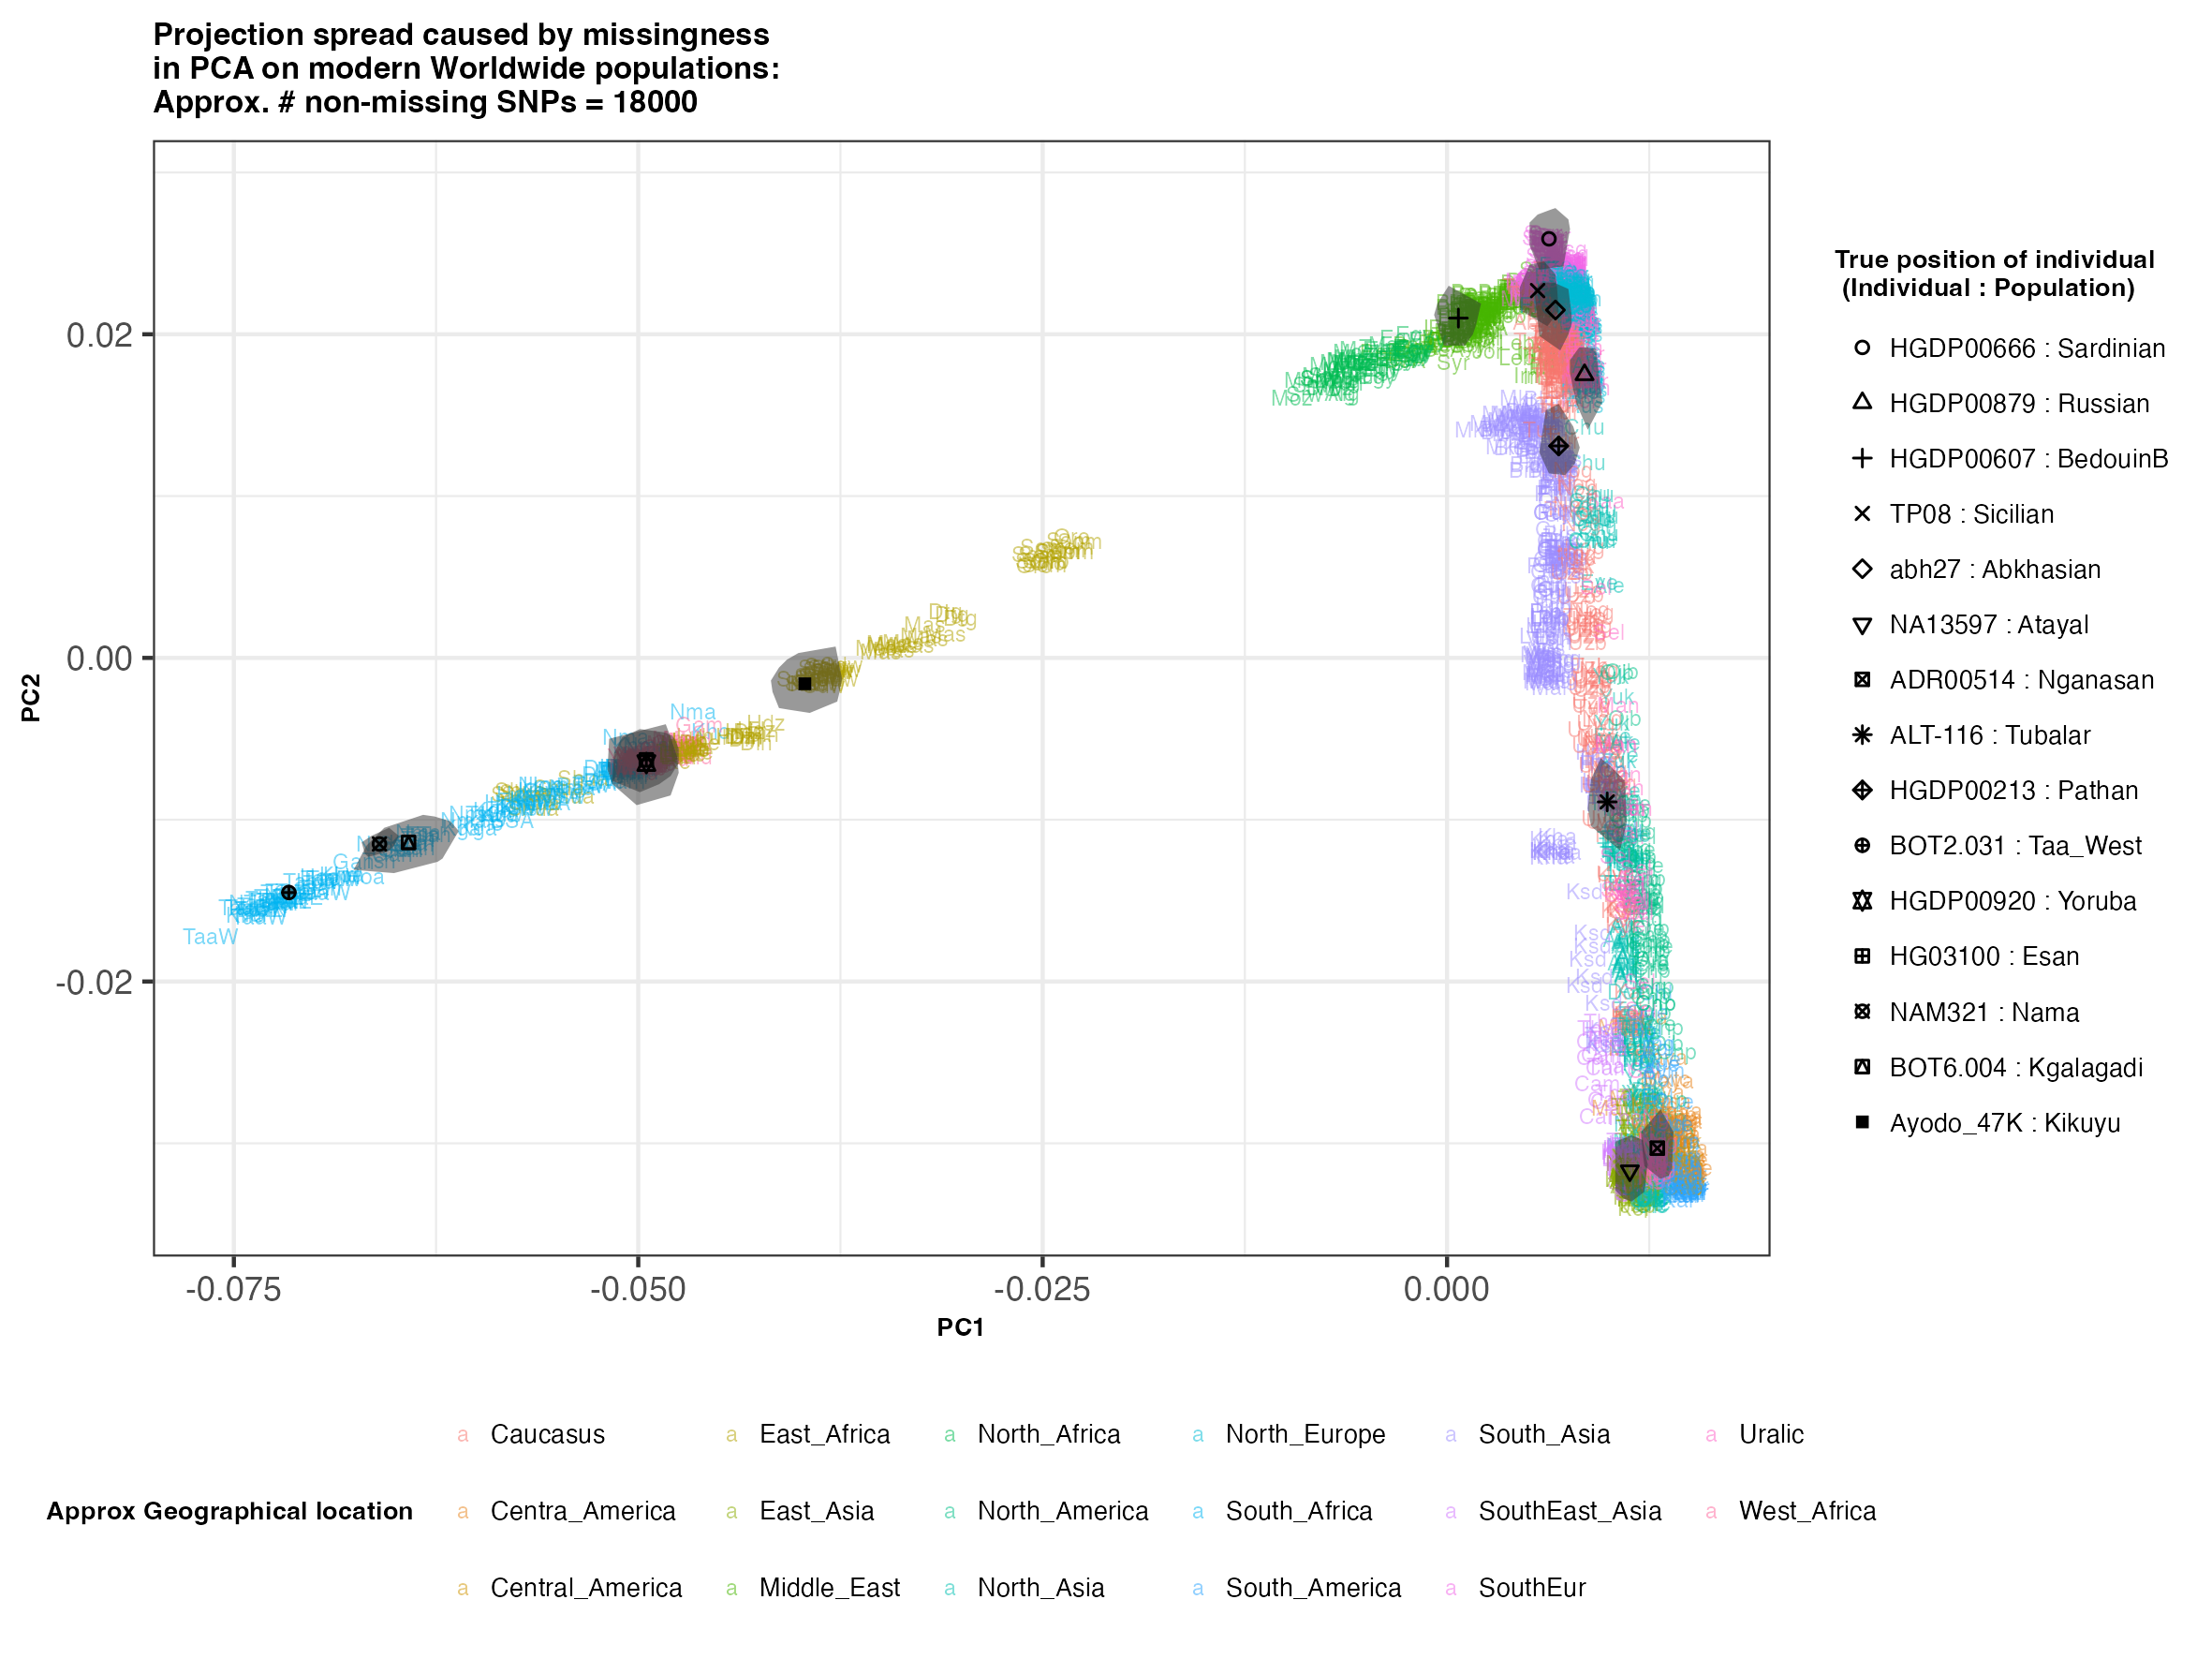
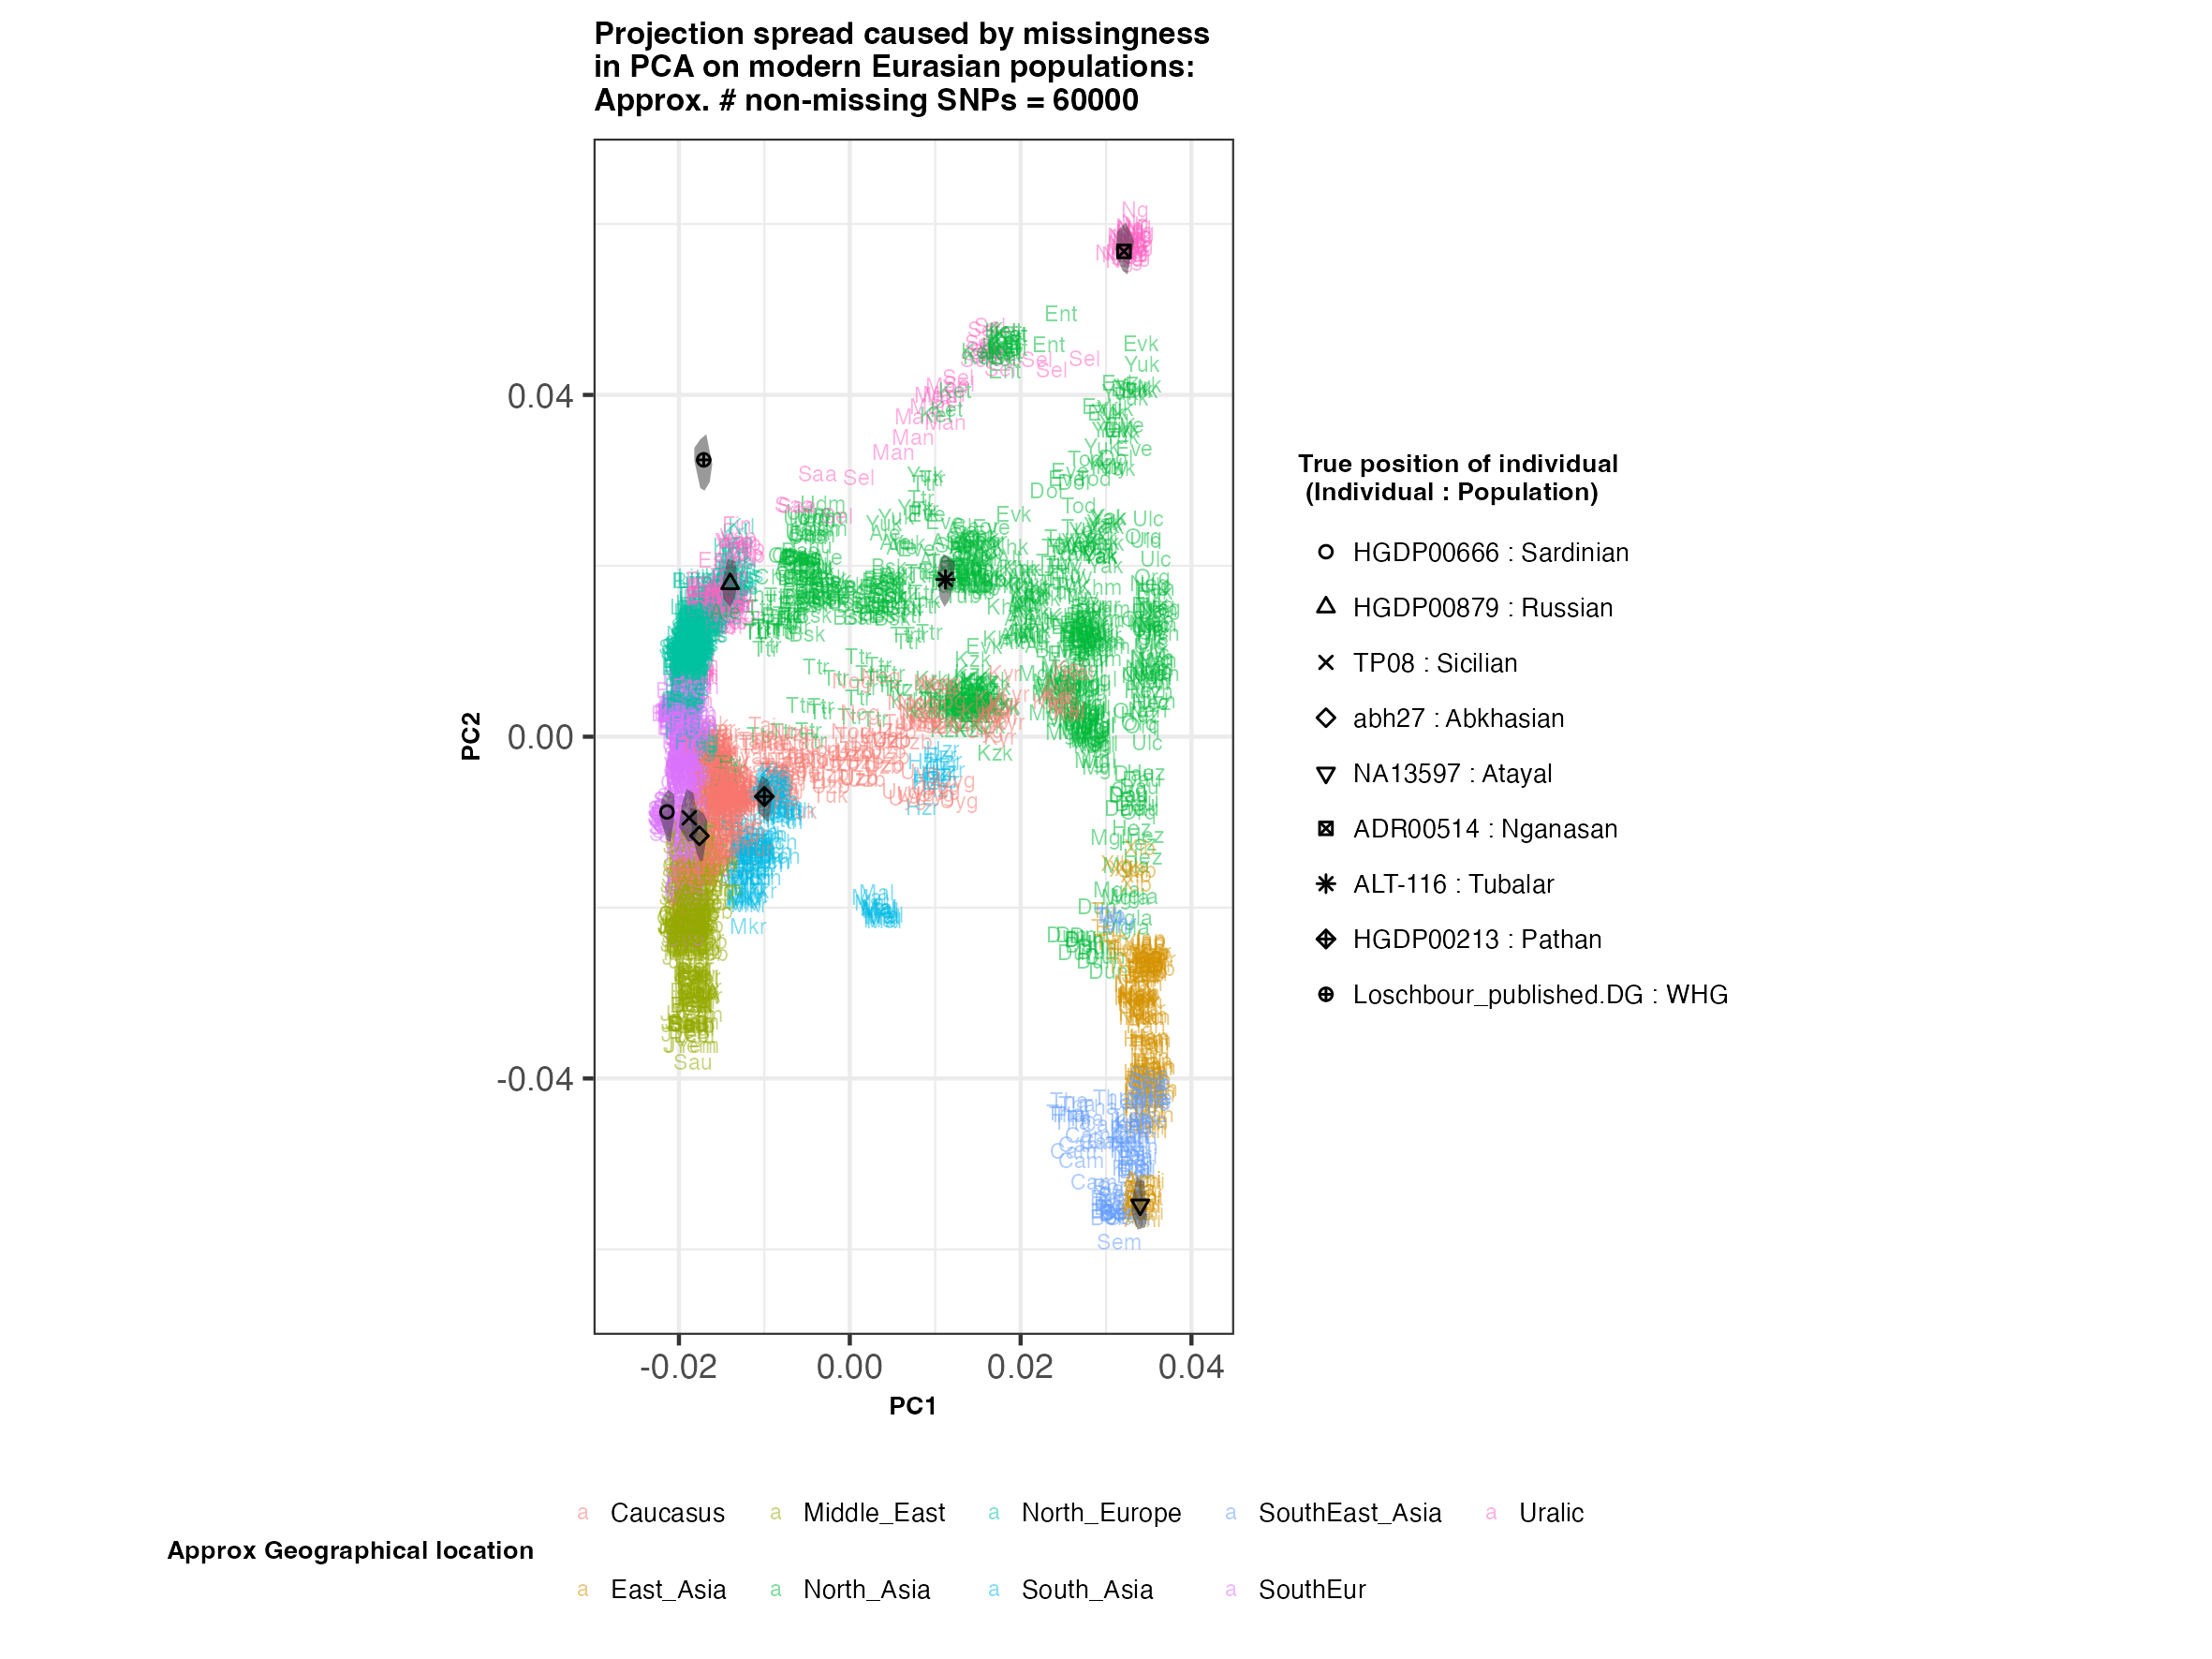
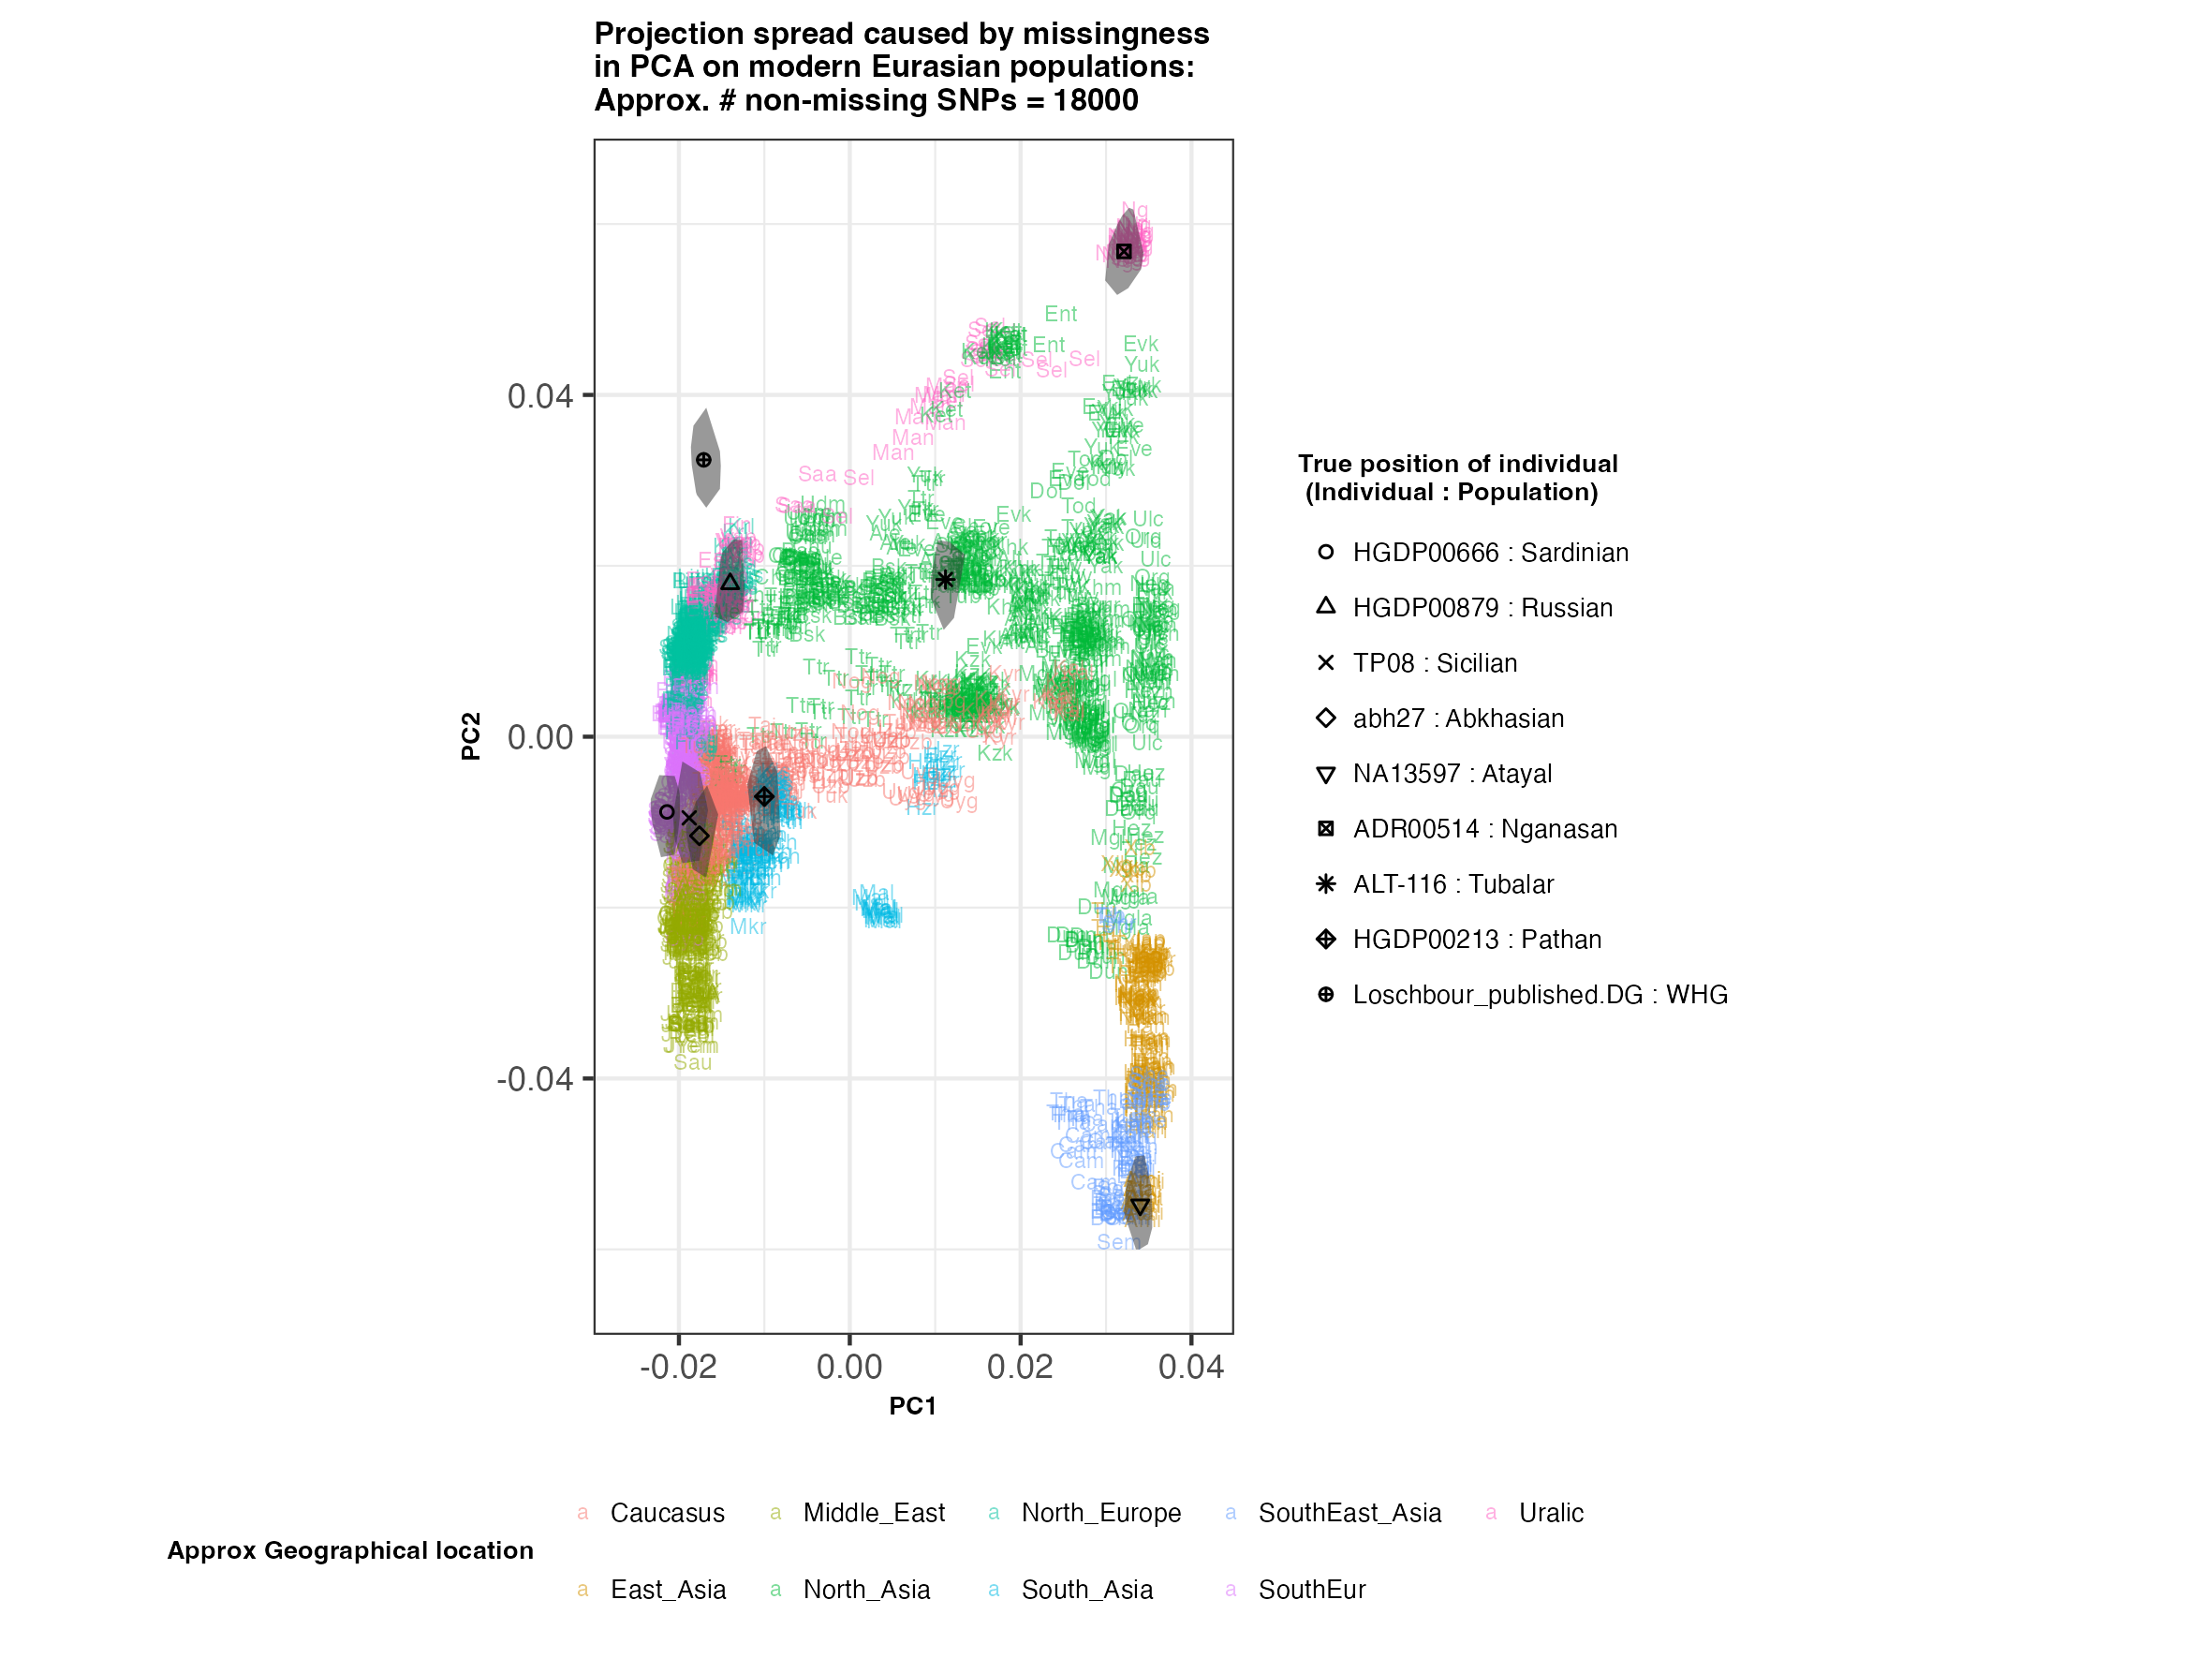
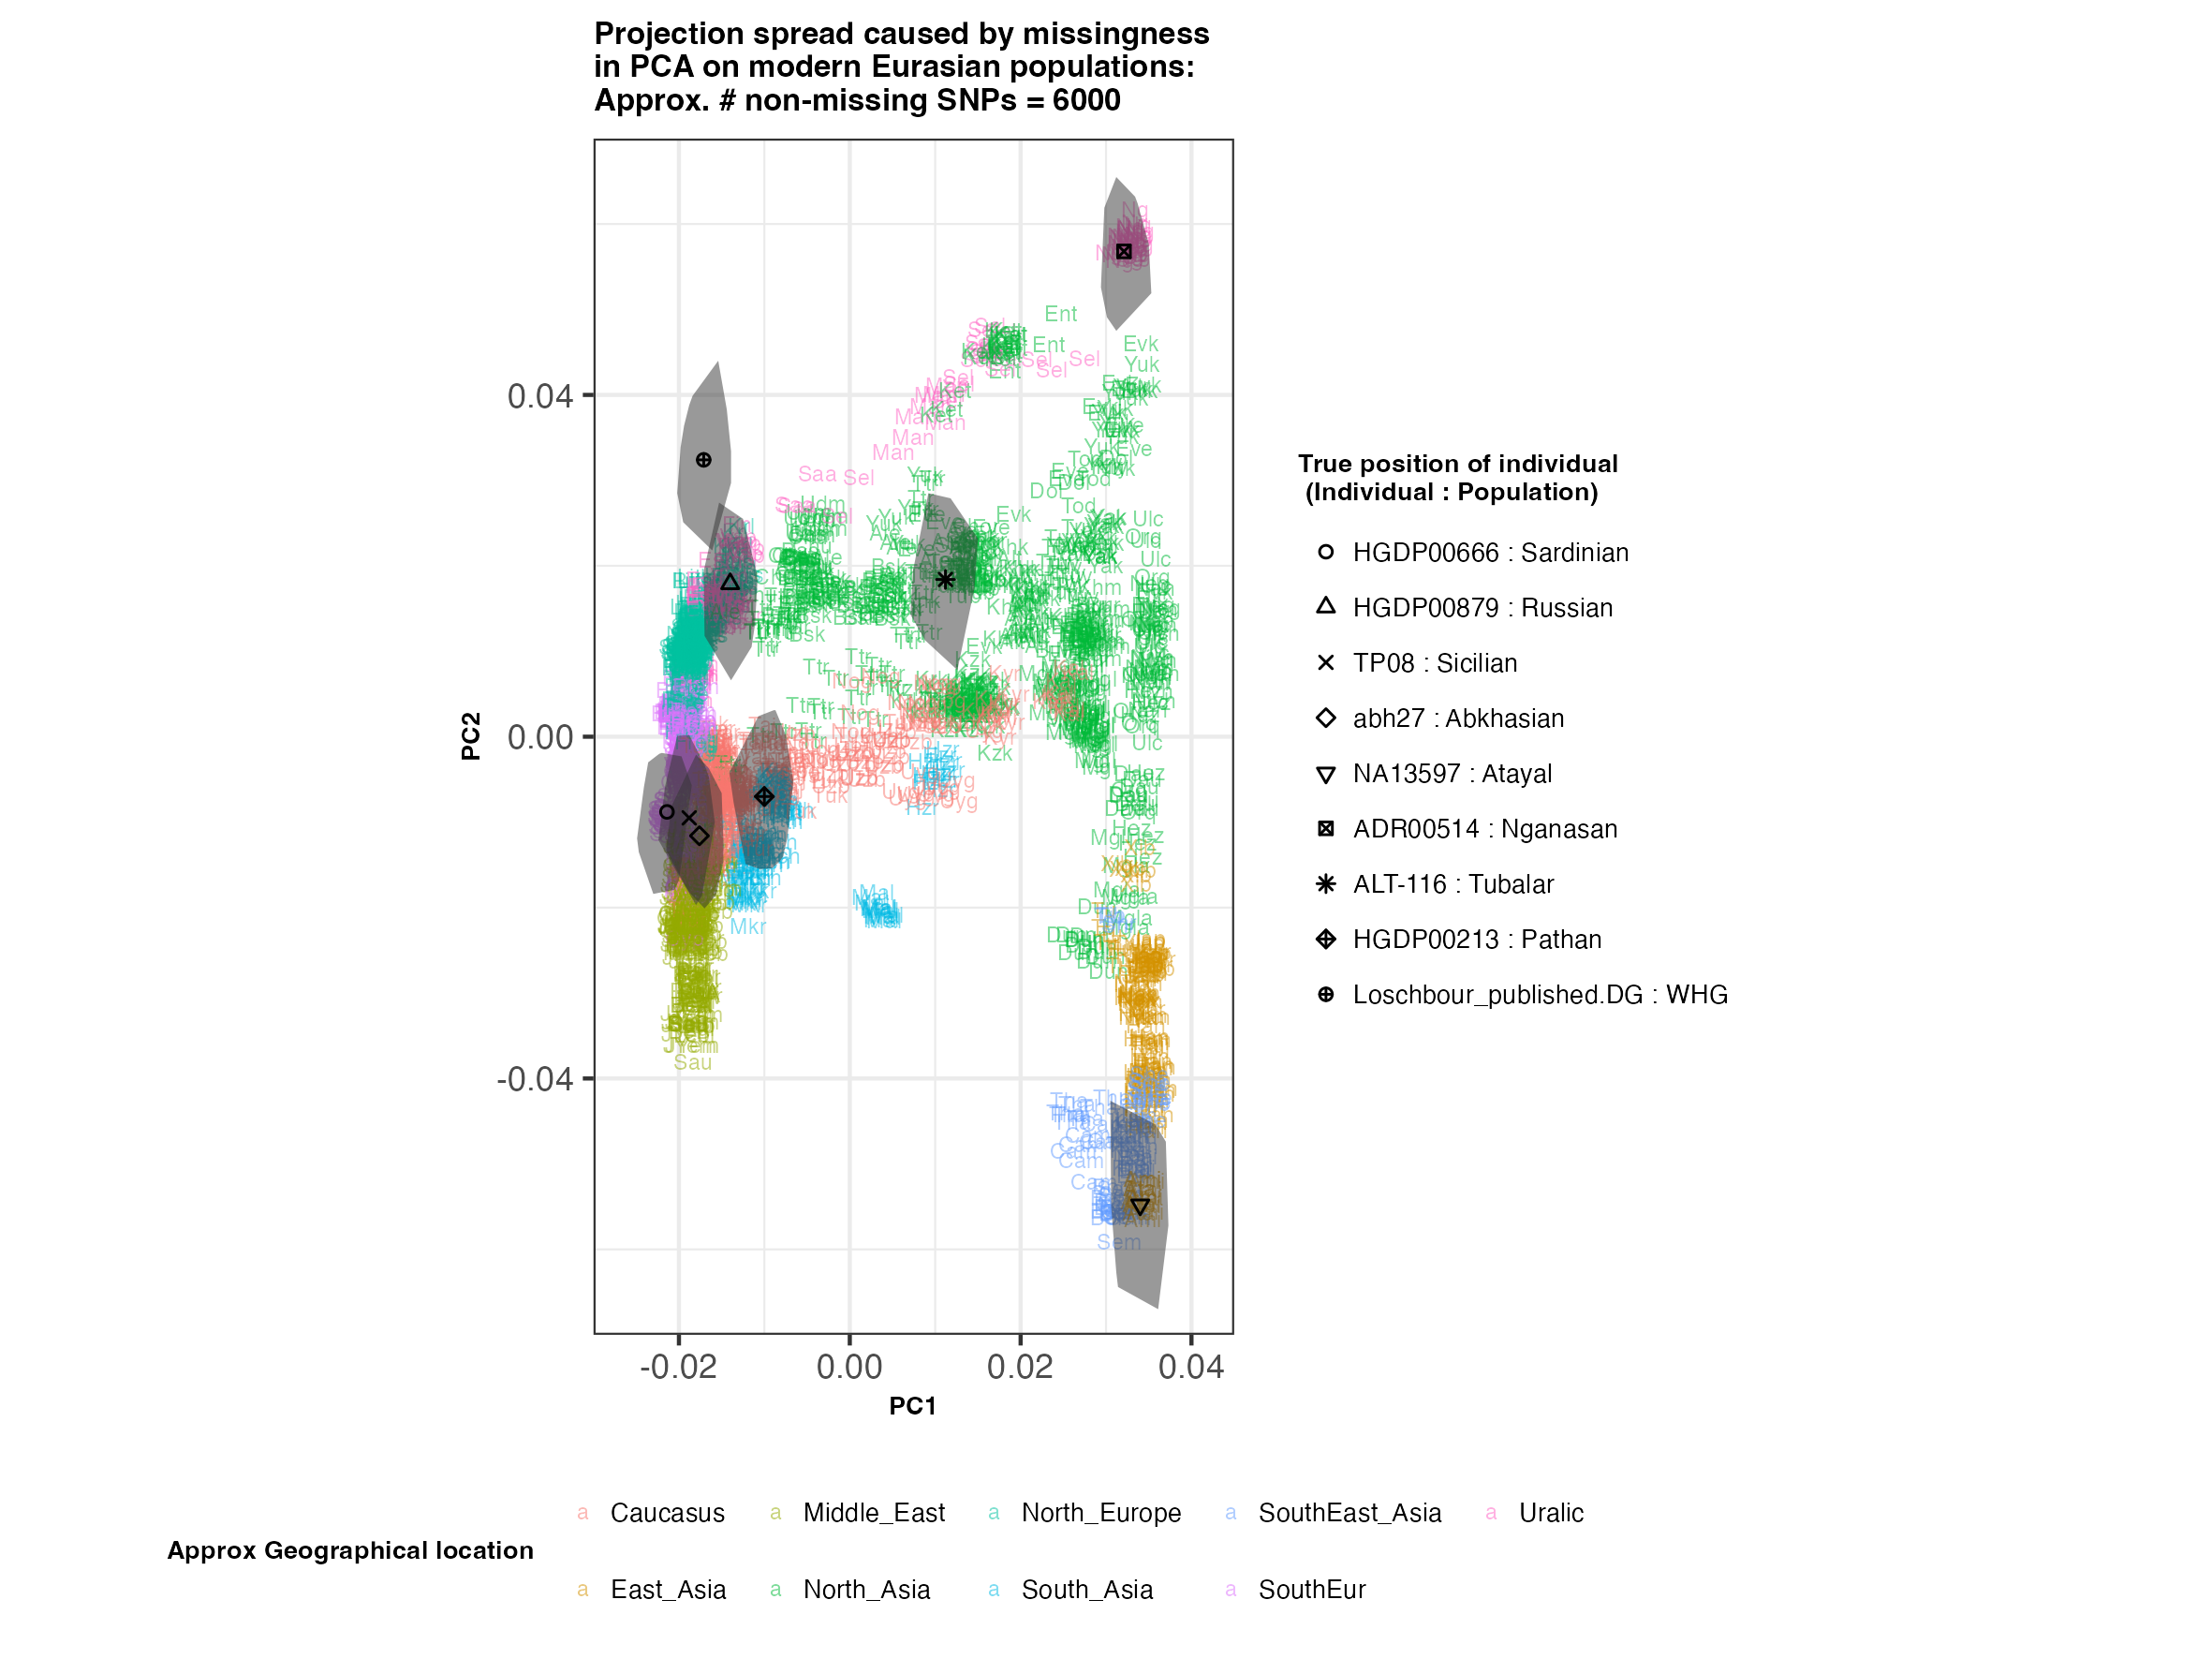
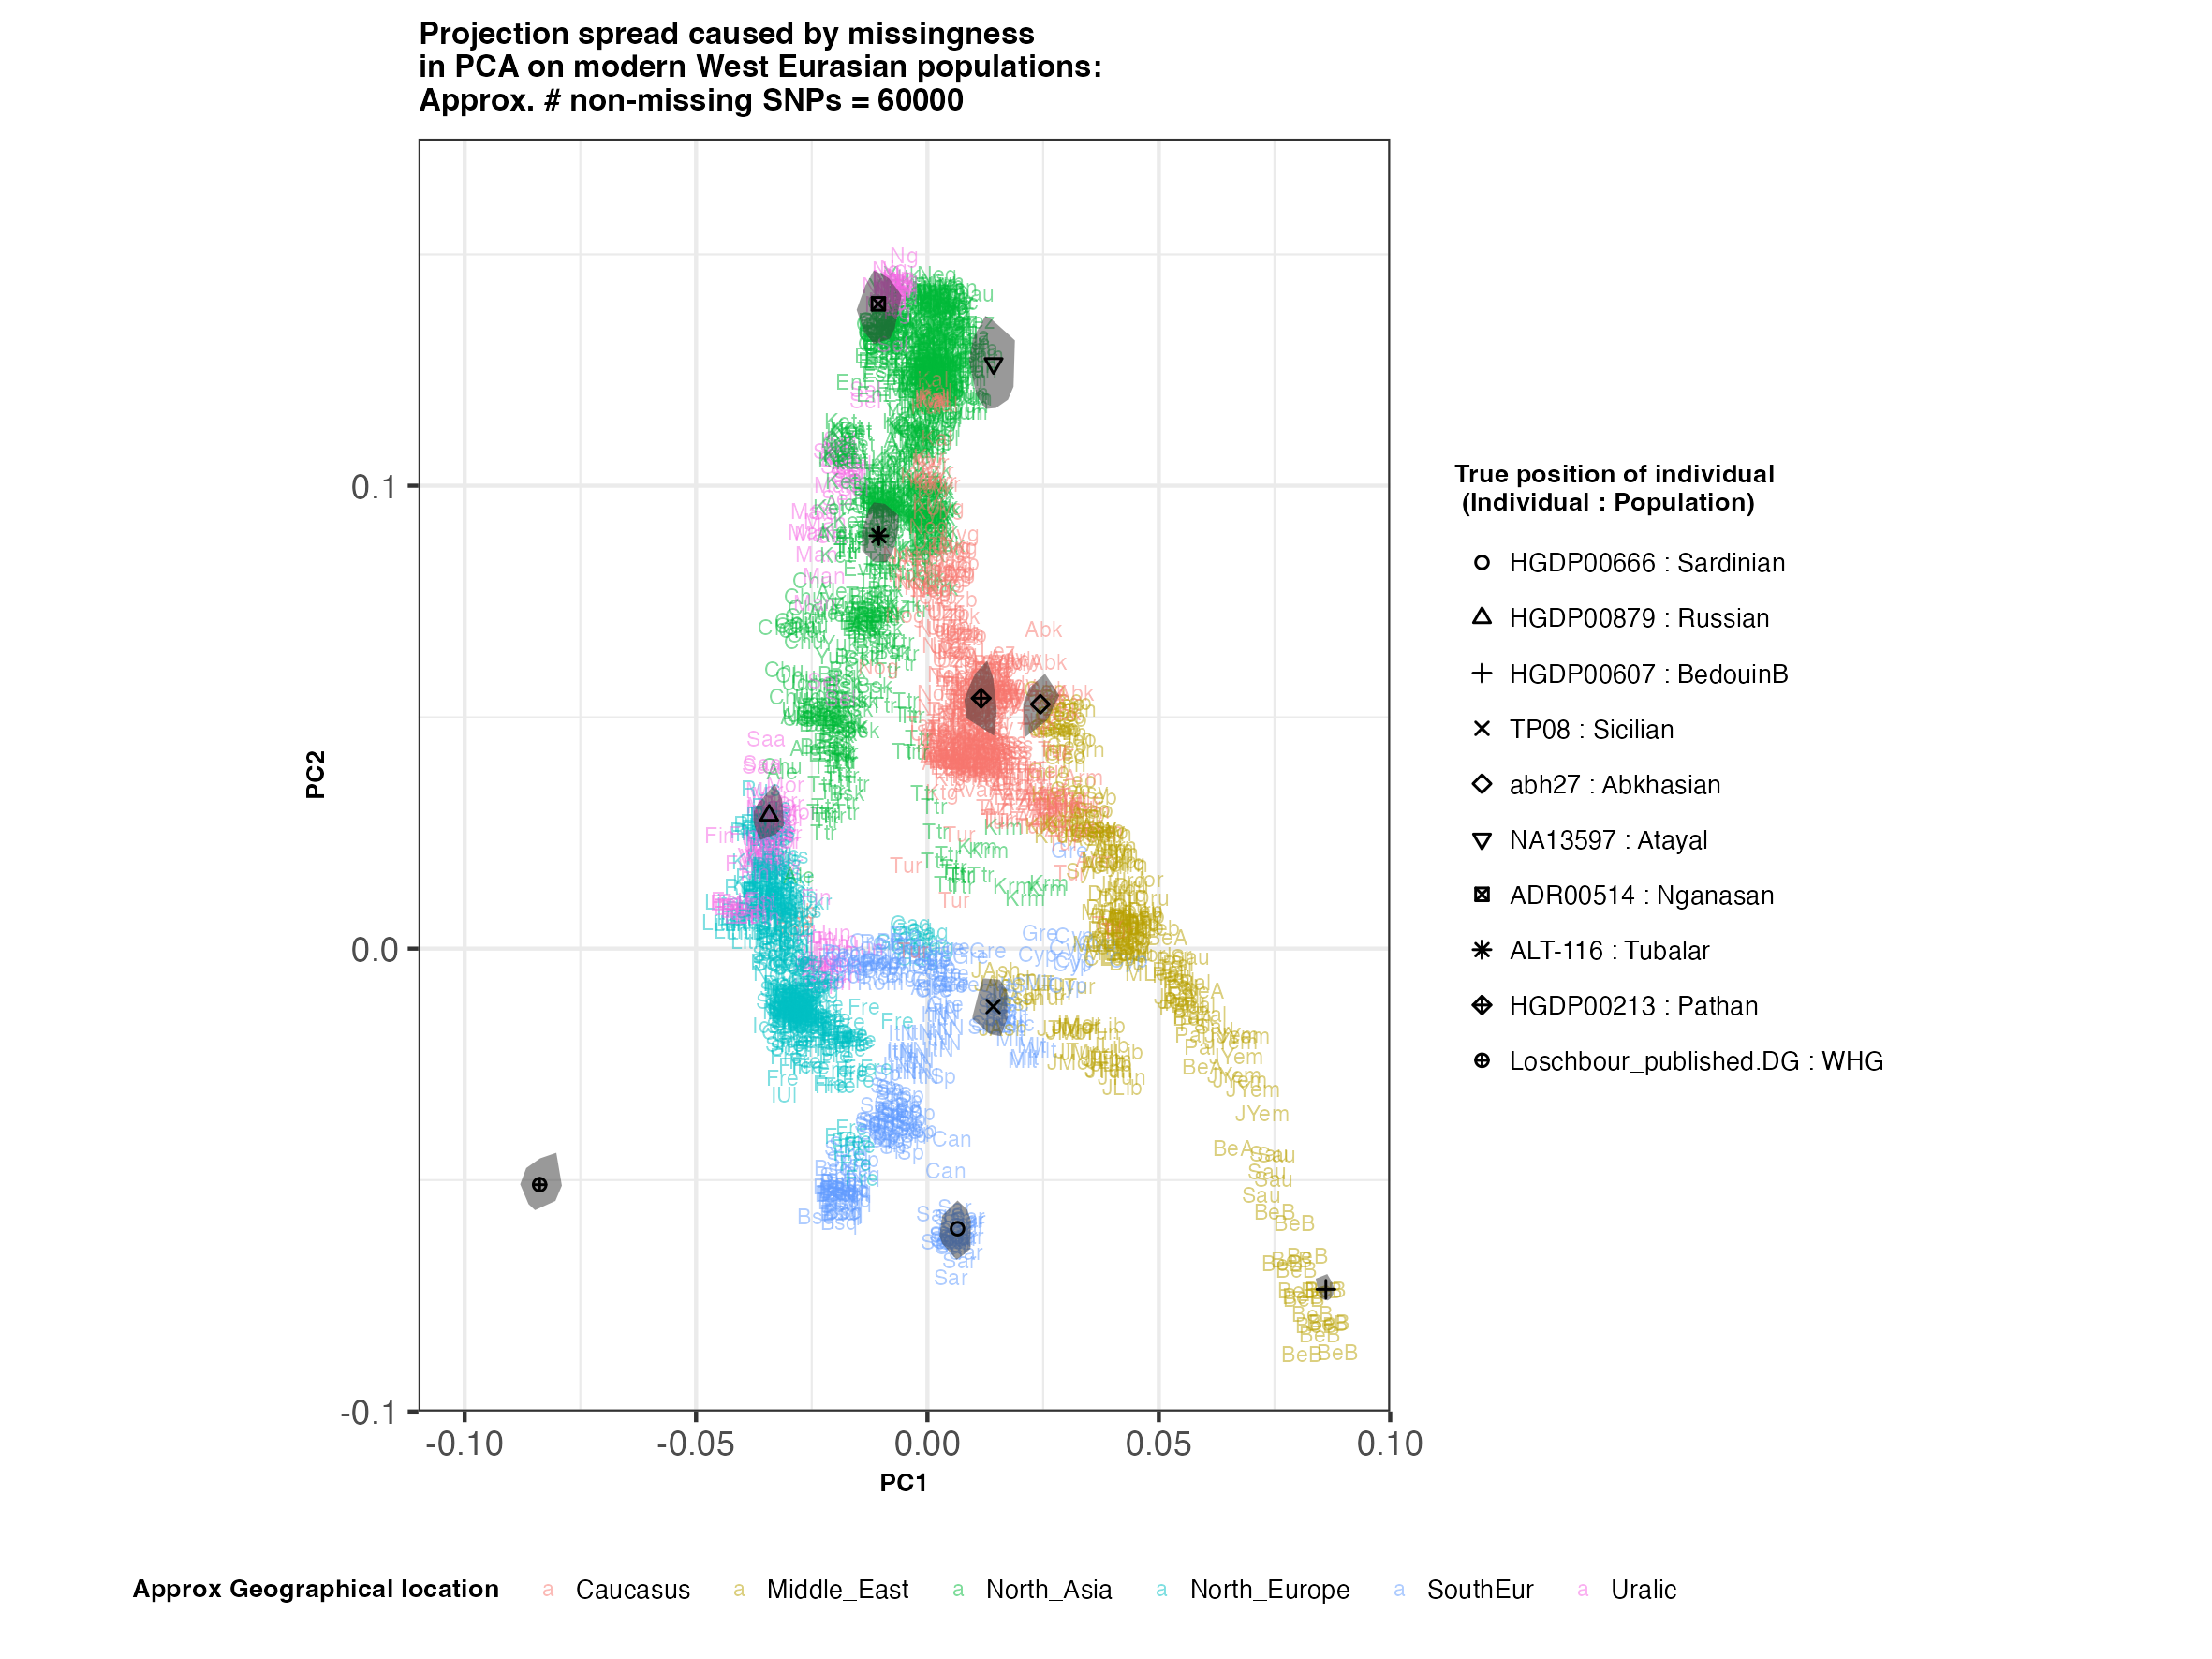
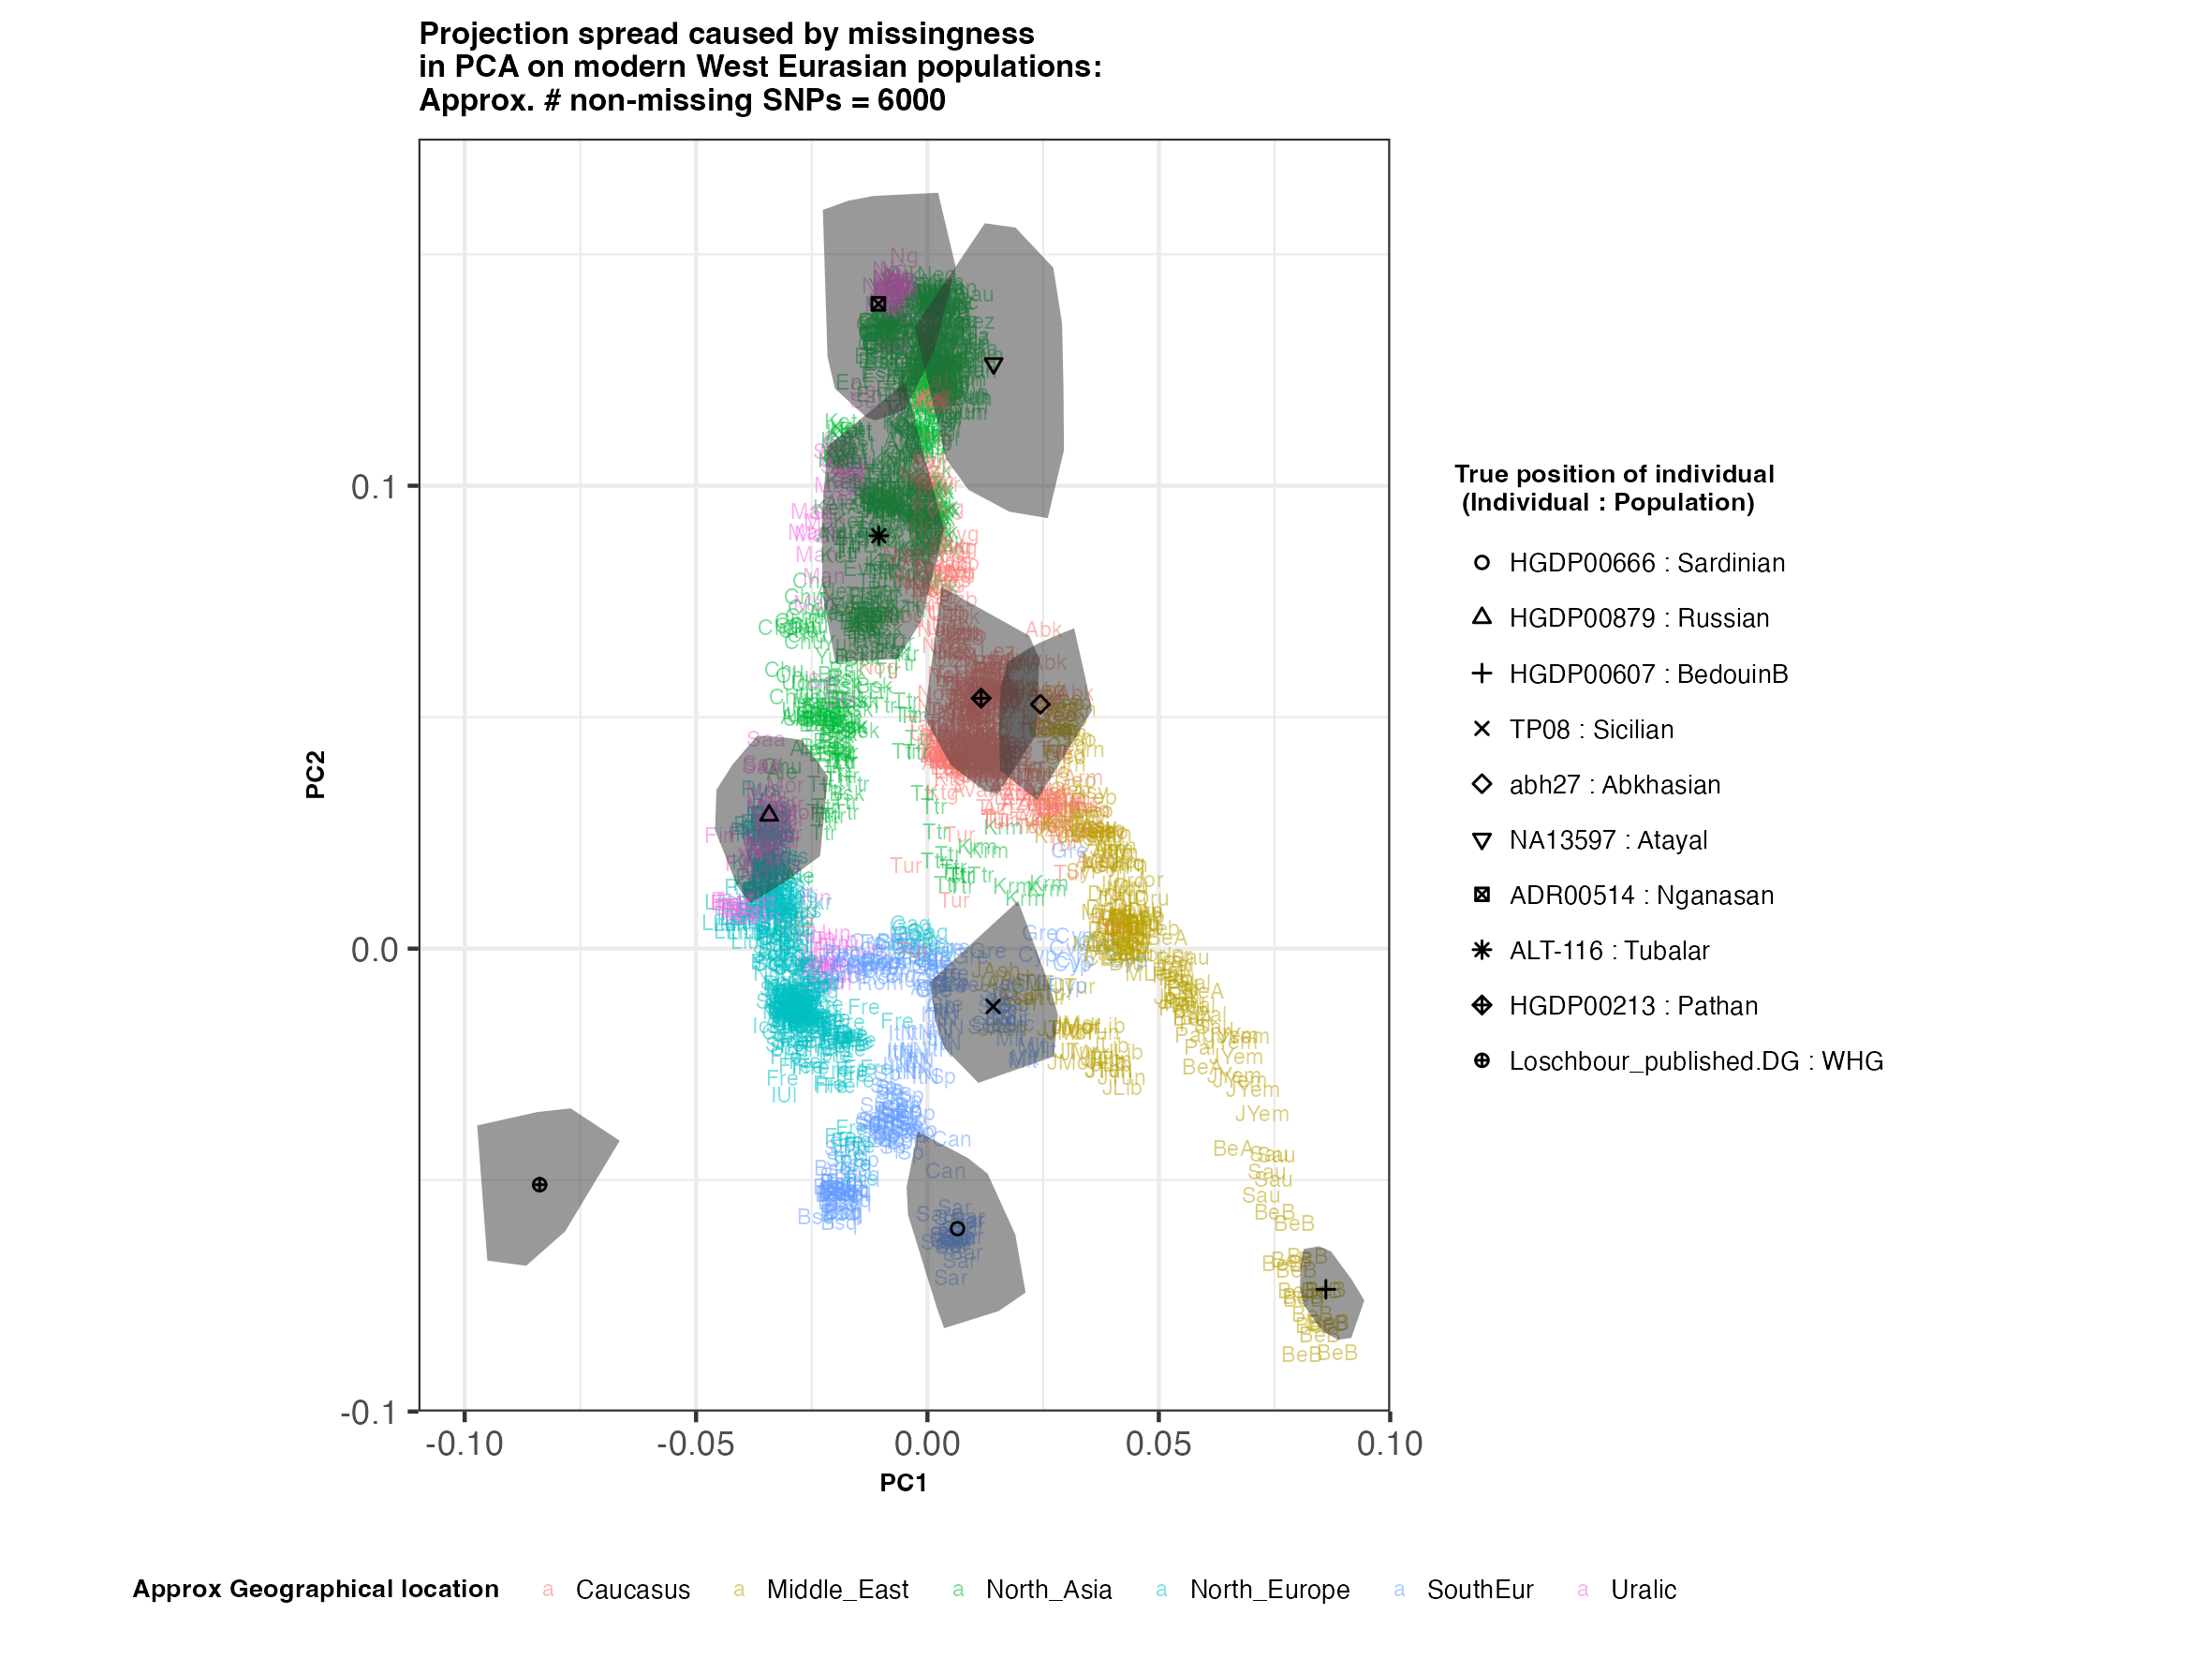
In each slideshow below, you can see the results for each of the regional PCAs for missingness rates of 90%, 97%, and 99%, corresponding to approximately 60.000, 18.000, and 6.000 covered SNPs resprectively. Present-day populations are shown in the background, plotted as a unique 3-4 letter code per population and coloured according to their approximate geographical location/region. The “true” position of each candidate individual (i.e. their position when using all the available genotypes) is shown by black symbols. Around each of these symbols, the convex hull of the 200 replicates with artificially-introduced missing genotypes is plotted, representing the variability of the projected placement of the replicates individuals.
(You can right click on any of the images below and select “Open Image in a New Tab” to see them in more detail.)
Worldwide

Africa

Eurasia
West Eurasia

Conclusions
In the ancient population-genetics literature, the commonly chosen cutoffs are both sensible and (strictly speaking) arbitrary, typically ranging between 10.000 and 20.000 covered SNPs. Any individuals with fewer than that number of SNPs are often excluded from downstream analyses. Looking at the results above, you can see why:
- The degree of variation in placement of the replicates at high missingness rates can make inferences of local ancestry based on PCA erroneous.
- e.g. with sparse enough data (99% missing), some replicates of the Sicilian individual ‘TP08’ in the West Eurasian are projected closer to present-day Greeks than the other Sicilians in the dataset. Indeed, with 18.000 SNPs (97% missing data), the spread of replicates is roughly halved (visually).
These cutoffs are not absolute, however. There are still things we can infer about individuals with a low number of covered SNPs:
- While the exact projection of low-coverage individuals in the Worldwide PCA is also affected, the spread of replicates shows that it is still perfectly possible to assess if a studied individual is genetically more closely related to present-day African, South Asian or Native American populations from the PCA results, even from only a few thousand SNPs.
- While not shown here, it should be noted that differentiating between Asian and Native American populations (whose positions appear similar in the Worldwide PCA plot above), will be possible when considering additional PCs.
An additional thing to note about the results from this analysis (especially when looking at the West Eurasian PCA) is that the spread of replicates around the ‘Loschbour’ hunter-gatherer is not visibly different for that around other candidate individuals. This suggests that damage artefacts, the pseudohaploid genotyping process, as well as the fact that this individual’s “true” position is also projected (unlike the other candidates, and hence its variation is not used in the calculation of the PCs), do not seem to exacerbate the spread of replicates. Given the small sample size (n=1), this suggestive result would need further corroborating.
Hopefully, these results help you gauge if and how much the position of your low coverage individuals on your favourite PCA can be trusted.
Caveats
The experiment performed here assumes that missingness is random, but it is conceivable that not every SNP has the same probability of getting lost through degradation processes.
The various spreads of replicates shown here are specifically for the Human Origins array dataset, and these specific PCA setups. The ascertainment of each dataset could alter the effects of missingness, depending also on how the PCs were calculated.